
Cardano whales buy the dip as ADA reclaims $0.211
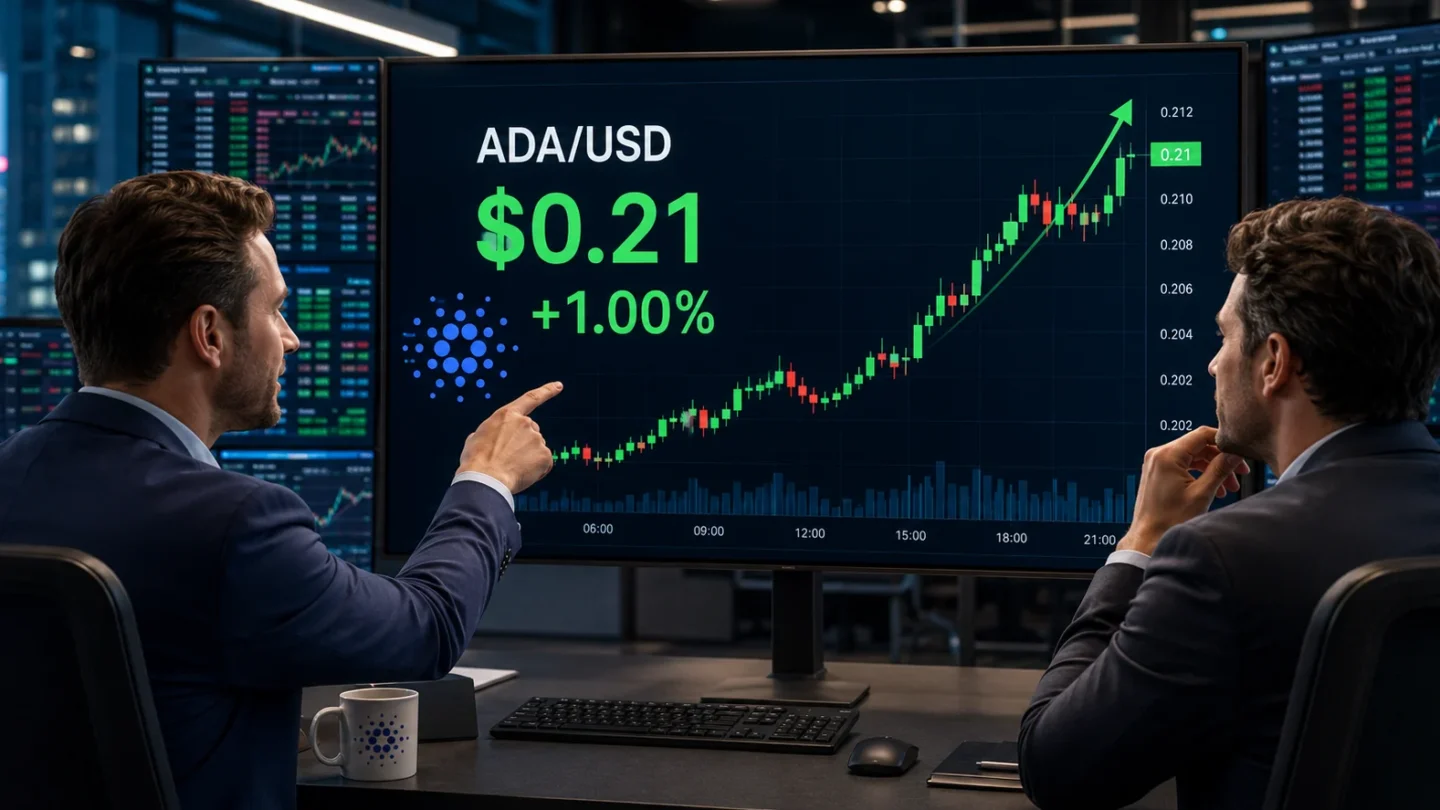
Key takeaways Cardano slipped to around $0.210 after losing more than 7% this week. Whales holding between 10 million and 100 million ADA accumulated 160 million tokens since Sunday. ADA’s long-to-short ratio fell to 0.74, indicating that bearish positions dominate the derivatives market. Cardano is trading at $0.210 on Friday after declining more than 7%…

Key takeaways
- Cardano dropped to roughly $0.210 following a weekly decline of more than 7%.
- Large-scale holders with 10 million to 100 million ADA purchased 160 million tokens since Sunday.
- ADA’s long-to-short ratio dipped to 0.74, showing a dominance of bearish positions in the derivatives market.
On Friday, Cardano is trading around the $0.210 mark, marking a weekly drop of over 7%.
Despite this downward movement, on-chain metrics reveal that major investors are actively buying the dip.
Even so, conflicting indicators from both derivatives and on-chain data point to ongoing hesitation among traders regarding whether ADA will mount a recovery or continue its descent.
Cardano Whales Buy Up 160 Million ADA
According to Santiment’s Supply Distribution metrics, prominent Cardano investors have used the recent price dip to increase their holdings.
Addresses holding between 10 million and 100 million ADA have acquired roughly 160 million tokens since Sunday. This buying spree suggests that certain high-net-worth investors view the discounted prices as an attractive long-term entry point.
However, this whale accumulation has not yet generated sufficient buying pressure to reverse Cardano’s immediate downward trend.
While whale buying during a correction often points to a healthy long-term outlook, it does not guarantee an instant price rebound—especially with the broader market remaining risk-averse.
Derivatives metrics present a highly divided outlook for Cardano. CoinGlass data indicates that ADA’s long-to-short ratio stood at 0.90 on Friday, nearing its lowest point in over a month.
A ratio below 1.0 indicates that short sellers outnumber buyers holding long positions, signaling expectations of further downward pressure.
This metric highlights that sellers still hold the upper hand in the derivatives space, despite the buying activity from major spot holders.
Conversely, ADA’s funding rate offers a slightly more hopeful signal. CoinGlass reports that the token’s open interest-weighted funding rate turned positive on Thursday, reaching 0.0013% by Friday.
A positive funding rate means long traders are paying short sellers to maintain their positions. This shift typically suggests a growing bullish presence, even while the overall long-to-short ratio remains skewed toward the bears.
This divergence between key metrics underscores the prevailing uncertainty regarding Cardano’s next short-term move.
Data from CryptoQuant aligns with this cautious stance. While the futures market has seen substantial orders from whales, selling pressure remains the dominant force, and several other indicators continue to hover in neutral territory.
Combined, these metrics reflect market indecision rather than a definitive trend in either direction.
ADA Holds Crucial Moving Averages
Cardano was valued at approximately $0.210 on Friday, down more than 7% over the course of the week. Despite this slide, the asset remains positioned above its 50-day and 100-day Exponential Moving Averages (EMAs), which sit at $0.190 and $0.197, respectively.
Trading above these key levels provides ADA with a minor short-term bullish bias, even though it remains trapped below significant overhead resistance.
Meanwhile, momentum indicators are showing signs of cooling. The Relative Strength Index (RSI) has pulled back toward the upper-50 zone, and the Moving Average Convergence Divergence (MACD) histogram is shrinking.
These shifts indicate that the buying pressure that fueled Cardano’s recent bounce is beginning to fade.
On the upside, Cardano faces its first major hurdle at $0.213, which aligns with the 50% Fibonacci retracement level of its recent drop.
A daily close above this resistance could pave the way for a move toward the 61.8% Fibonacci retracement level at $0.231, followed by horizontal resistance at $0.236.
Beyond those targets, a major supply barrier exists between the horizontal resistance at $0.245 and the 200-day EMA at $0.246. A convincing breakout above this threshold would significantly bolster the bullish thesis and open the door for further upward extension.
Should the price decline further, immediate support is located around the 38.2% Fibonacci retracement level at $0.195.
This price point is strengthened by the proximity of both the 50-day and 100-day EMAs, establishing a vital defensive zone for buyers. A daily close below this cluster could expose the 23.6% Fibonacci level at $0.173.
If selling intensifies and ADA breaks below $0.173, the price could slide further toward its deeper structural support near $0.150.
Ultimately, while whale buying provides a silver lining, conflicting derivatives signals and decelerating momentum leave Cardano’s near-term recovery prospects highly uncertain.