
XRP dips below the $1.30 support amid bearish positioning
Key takeaways XRP has dropped below $1.30 on Thursday as the bearish trend persists. Long-to-short ratios stand at 0.82, indicating bearish positioning in the tracked data. XRP must reclaim resistance between $1.333 and $1.372 to improve its near-term technical outlook. XRP struggles after Fed’s cautious hold XRP remains under pressure on Thursday as bearish derivatives…

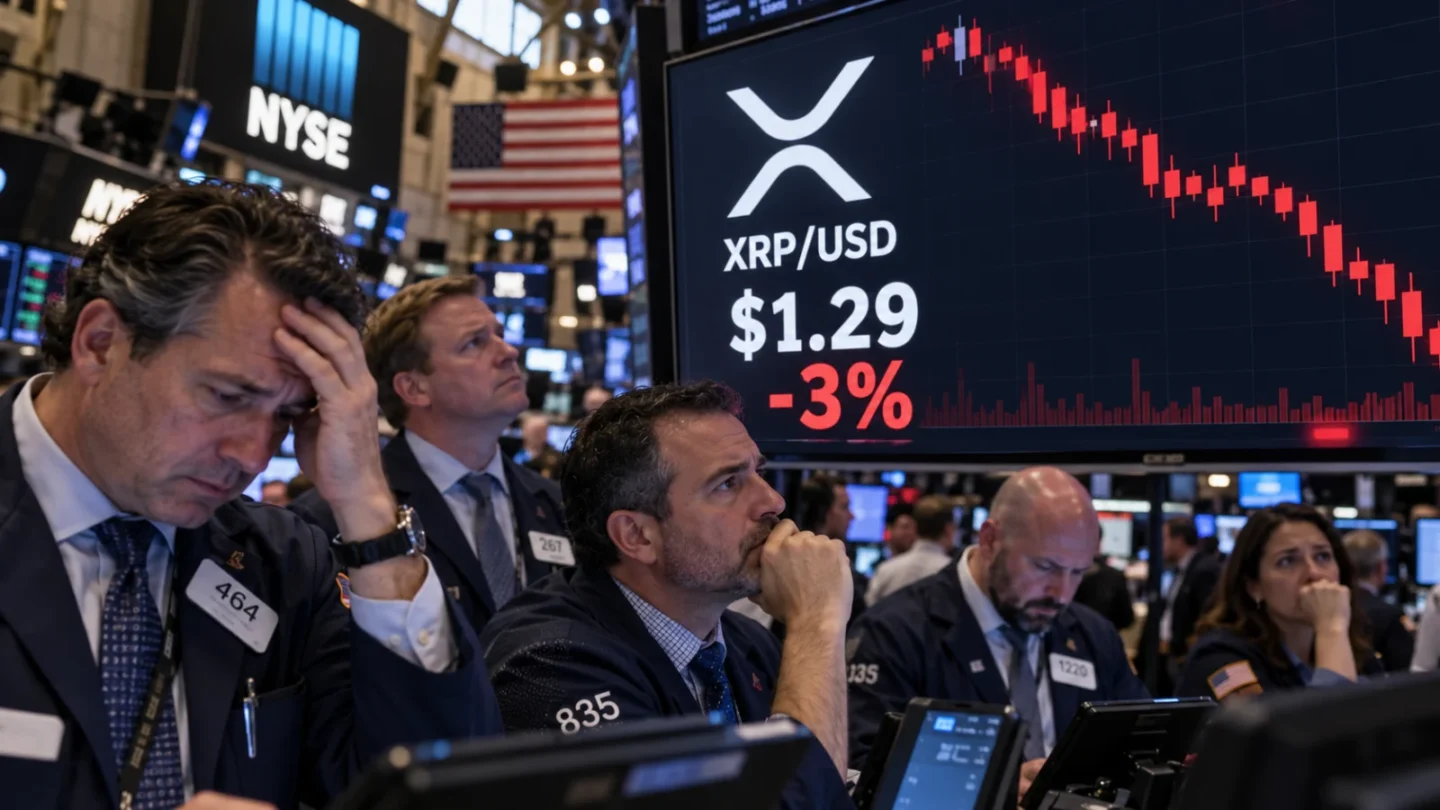
- XRP fell below $1.30 on Thursday as ongoing bearish momentum persisted.
- The market’s long-to-short ratio stands at 0.82, reflecting a dominant short bias in tracked data.
- XRP must recover the resistance zone between $1.333 and $1.372 to brighten its short-term technical outlook.
XRP struggles after Fed’s cautious hold
XRP remained under sell-side pressure on Thursday as bearish derivatives positioning and continuous selling activity restricted its recovery potential.
The token traded around $1.29, breaking below the crucial $1.300 support level following the Federal Reserve’s decision to keep benchmark interest rates at 3.75%–4.00%.
Although rates remained unchanged, central bankers’ hawkish tone and persistent inflation concerns dampened investor demand for risk assets.
CoinGlass data reveals XRP’s long-to-short ratio dropped to 0.82, closing in on its lowest level in over a month.
A ratio below 1.0 indicates that short positions outnumber long positions in the recorded dataset, underscoring cautious trader sentiment toward the assets.
Conversely, funding rates present a contrasting perspective. XRP’s funding rate sat at 0.0036%, staying positive after moving higher on October 16.
This positive rate indicates that long position holders are paying shorts, reflecting sustained interest in leveraged bullish trades despite the depressed long-to-short ratio.
While this divergence leaves derivatives indicators mixed, sellers maintain overall control for now.
CryptoQuant’s summary metrics highlight sell-side dominance across both spot and futures markets for XRP.
The analytics platform also points to substantial whale orders and overheated market conditions for XRP. While large orders by themselves do not confirm whether major holders are buying or dumping, the associated supply imbalance reinforces a weak market outlook.
Similarly, XLM’s spot and derivatives markets indicate that sellers retain the upper hand, suggesting its recent bounce lacks sufficient buying volume to sustain an extended move higher.
XRP could record further losses as it drops below the $1.300 support
The daily XRP/USD chart maintains a bearish structure after the asset breached its horizontal floor near $1.300.
A daily candle close beneath that line would further undermine the recent trading structure, heightening the risk of a steeper downturn.
The daily Relative Strength Index (RSI) is at 40, hovering below the neutral 50 threshold and signaling weak buying interest.
The Moving Average Convergence Divergence (MACD) indicator has ticked slightly into positive territory, offering an early hint of diminishing downward momentum, even though the token remains constrained under its primary moving averages.
XRP faces its immediate overhead barrier at the 100-day Exponential Moving Average (EMA) near $1.333. Above that, the 50-day EMA at $1.357 and the 200-day EMA at $1.372 present further resistance.
Clearing this technical cluster would offer stronger confirmation that buyers are regaining control. Higher resistance targets lie at $1.540 and $1.900, though both remain well above current price levels.
At present, XRP’s position just above support leaves very little margin for additional selling. Defending $1.300 and pushing past nearby moving averages represent the critical hurdles for a lasting recovery.